Rebuilding: Understanding the Impact of COVID Through Data
At Oyster Sunday, we believe that understanding the world through data helps us make sense of what is in front of us.
In trying to understand government responses to COVID-19, the impact on the restaurant industry, and what diners expect from restaurants, we turned to sources that published the data they collected in the form of infographics. We find that digesting information through data + graphic visual representations allows us to support our own observations with factual information.
Below is a collection of infographics to help us understand the world we currently live in as of May 2020.
—
Worldwide | Government Responses ⟶
Worldwide | Government Responses to COVID-19
On March 11, 2020, the World Health Organization declared the COVID-19 outbreak a global pandemic. To understand our response in the US, we wanted to first level-set with data on a country-by-country basis. The variance of response by country was drastic, which enabled some to limit the spread of the virus and potentially reduce the number of deaths compared to others.
As Our World In Data Notes, “To understand which policies might be effective in controlling the outbreak – especially as countries move towards easing restrictions – it’s essential that we have a good dataset on the timing and stringency of responses across the world.” Below is a breakdown of government responses around the world. [Source]
USA | Restaurant Industry Impact Due to COVID-19
BentoBox, a website host and developer optimized for the needs of restaurants, analyzed 5,000 restaurant websites around the US from March 2020 - May 2020 to to gain insight into how COVID-19 affected restaurant operations and guest behavior. Here is what the data shows [Source]:
Decline in Gatherings and Events
Increase in Gift Card, Merchandise and Online Ordering Sales
Restaurants Adapt to Changing Environment
Increase in Gift Card Sales
Increase in the Volume of Online Orders
As cities began to instruct residents to stay indoors, practice social distancing and self-quarantine, catering and event tickets declined. Restaurants and bars elected to close to slow the potential spread. Governments suggested that no gatherings of over 50 people should take place, quickly turning to no more than 10. As cases grew, governments ordered restaurants and bars to operate takeout and delivery only. States ordered residents to shelter in place.Reservation requests declined and flattened across the U.S. (below). Restaurants began to pivot to new ways of generating revenue. - BentoBox
On March 12th, gift cards, merchandise and online ordering for pickup and delivery sales began to trend upwards. Industry personalities, chefs, restaurateurs, and more advocated for guests to purchase gift cards to support their favorite restaurants’ bottom line, in hopes of using it when the dust settles. Merchandise sales also trended upward as restaurants began offering Community Supported Restaurant Shares, branded merchandise, and ready-made meals-to-go through their online shops. Restaurants received government-mandated orders to operate online ordering for pickup and delivery only. It’s important to note that BentoBox first launched online ordering for pick up and delivery in February 2020. - BentoBox
As government mandates and regulations began to go into effect in mid-March, restaurants started using online catering to provide alternative offerings to their guests such as meal kits, wine retail, family meals, and more. Online ticket orders also began to grow as restaurants got creative, selling tickets to virtual cooking/baking classes or future re-opening events, while directing proceeds to their staff. - BentoBox
Gift card sales increased dramatically across 5 states—collectively a 10x increase. New York gift card sales doubled every day from 3/14-3/17. - BentoBox
As the number of cases continued to increase, restaurant trends changed in real-time. The resilient nature of the industry is evident as operators and guests have learned new ways to support their favorite restaurants and continue to help their communities. - BentoBox
USA | What Diners Expect From Restaurants
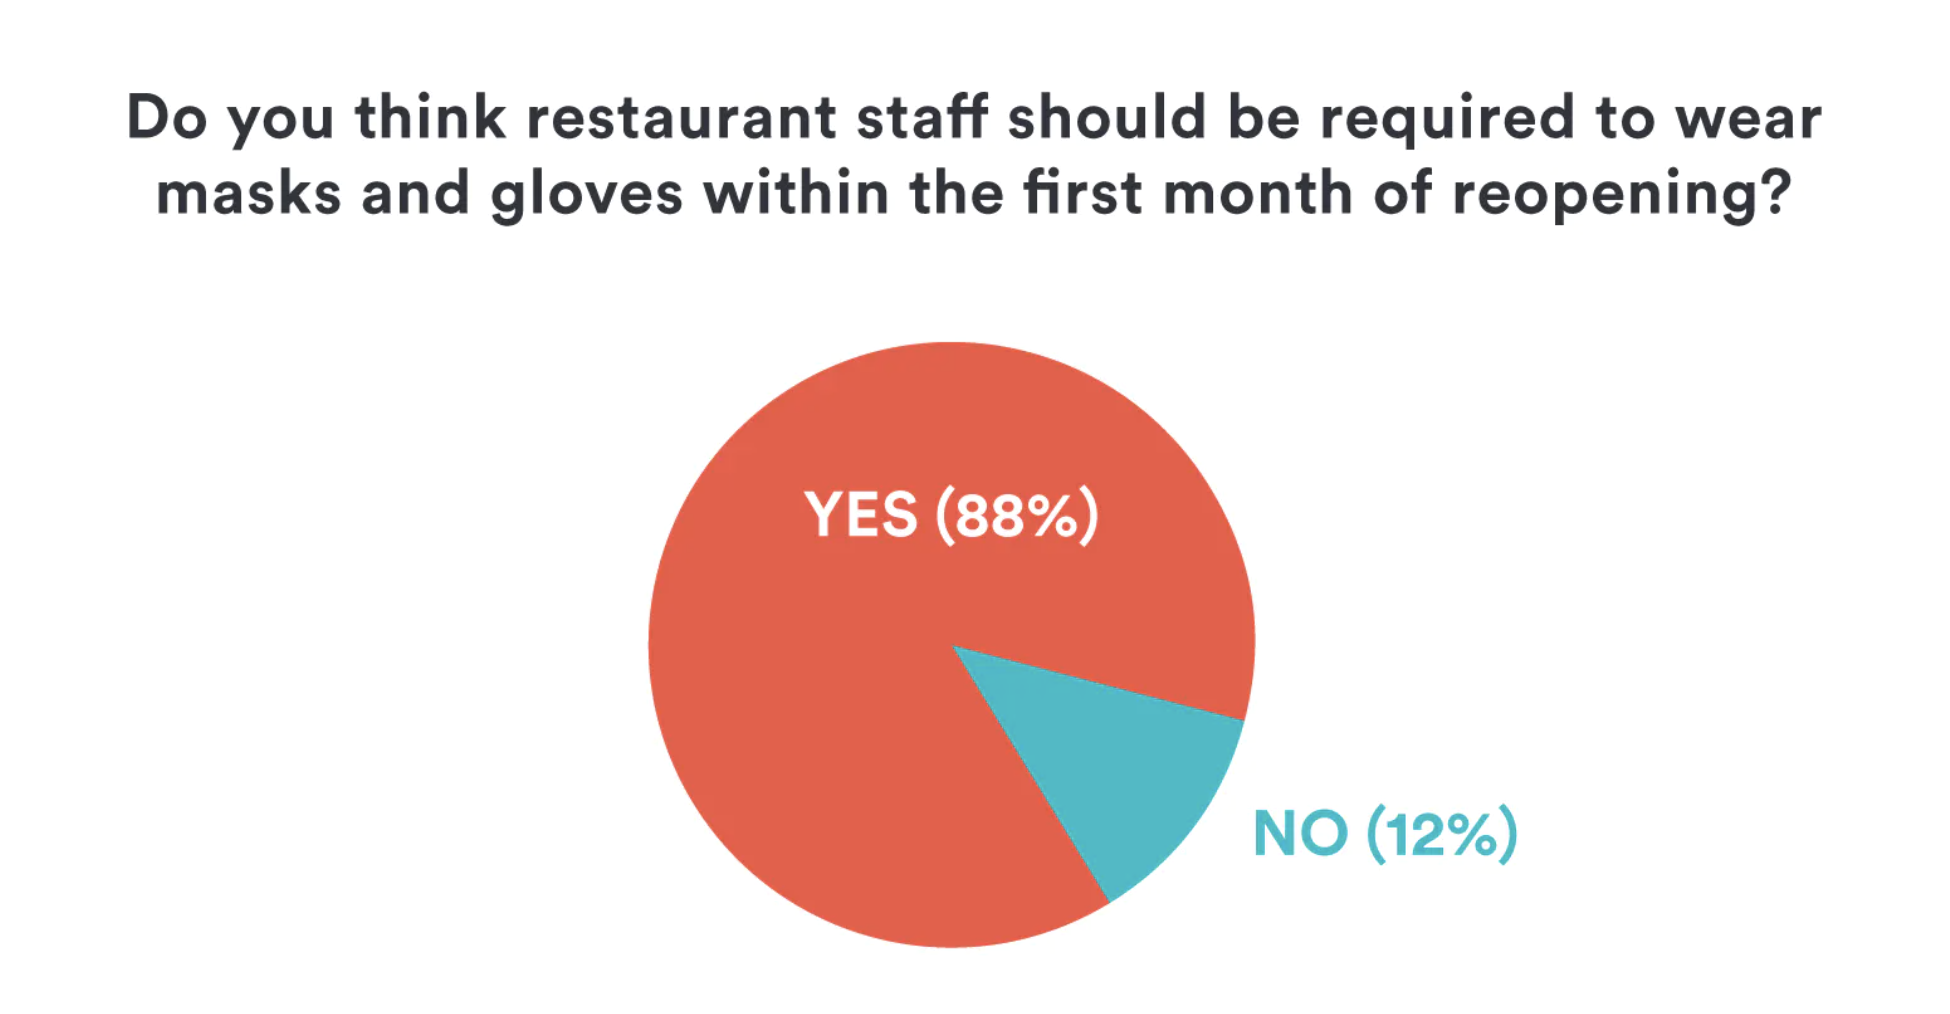
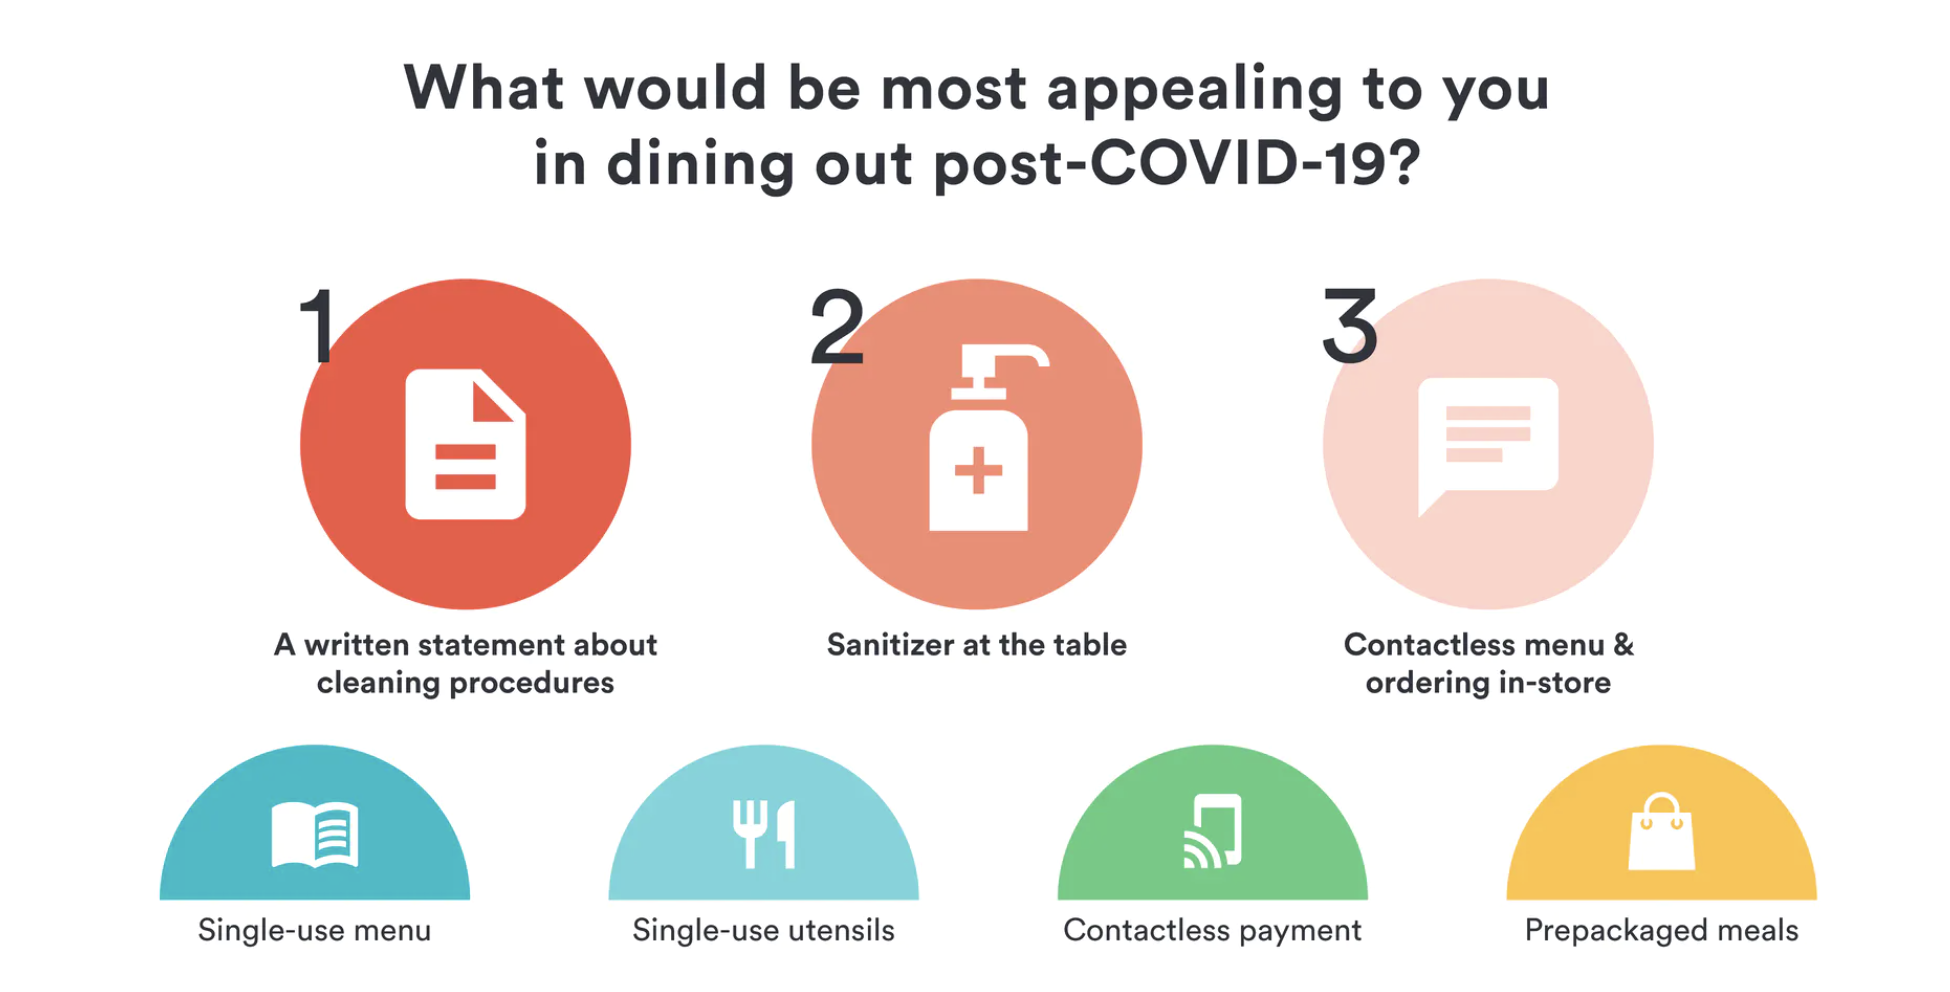
BentoBox surveyed a representative set of 500 diners from across the nation to gain insight into what restaurants should implement in their reopening strategies. As restaurants start to reopen their doors, getting a glimpse into a consumer's perspective is helpful. We understand that this particular data set is limited but, it is a valuable glimpse to help navigate guest expectations and general sentiments. [Source]
Disclaimer: The consolidated resources are here for your consideration. The information provided above is not legal advice. We recommend talking to your lawyer to ensure all state + federal compliance is maintained. If you do not have legal representation, we would be happy to connect you with legal counsel. We understand that circumstances are changing quickly and we are updating content as it is available.


